Getting and Editing Chart Configs
You can easily edit the information that you have given to the chart, including chart properties, its colors, and the header and footer descriptions. Let’s see how to do that.
First, let’s get a list of the chart’s configs:
curl -X 'GET' \
  'https://api.plotset.com/v1/chart/<Your chart id>/config' \
  -H 'accept: application/json' \
  -H 'Authorization: <Your API Key>'
You can use two ways to change the setting options:
the first method: Updating Configs
In this method, you need to insert all the setting options completely. It goes like this:
curl -L -X PUT \
 'https://api.plotset.com/v1/chart/<Your chart id>/config' \
 -H 'Content-Type: application/json' \
 -H 'Accept: application/json' \
 -H 'Authorization: <Your API Key>' \
 --data-raw '{
  "chart.fontSize": 12,
  "chart.background": "#ffffff",
  "...": "..."
 }'
the second method: Patching Configs
Now if you wish to only change a few things in your chart’s configs, you should try this method. Here’s how it works:
curl -L -X PATCH 'https://api.plotset.com/v1/chart/<Your chart id>/config' \
-H 'Content-Type: application/json' \
-H 'Accept: application/json' \
-H 'Authorization: <Your API Key>' \
--data-raw '{
  "chart.fontSize": 12,
  "chart.background": "#ffffff"
}'
Let’s go back to our example and see how we can modify the chart’s configs using our API.

Maybe you prefer dark mode, just like me! So, why don't we change the background color to a darker version?
curl -X 'PATCH' \
 'https://api.plotset.com/v1/chart/<Your chart id>/config' \
 -H 'accept: application/json' \
 -H 'Authorization: <Your API Key>' \
 -H 'Content-Type: application/json' \
 -d '{
 "palette.bg_color": "#102c51"
}'

Oops! With dark mode, it’s better to choose a bright color for labels.
curl -X 'PATCH' \
  'https://api.plotset.com/v1/chart/<Your chart id>/config' \
  -H 'accept: application/json' \
  -H 'Authorization: <Your API Key>' \
  -H 'Content-Type: application/json' \
  -d '{
  "xAxis.position": "top",
  "xAxis.labelnumb": 16,
  "xAxis.labelcolor": "#ffffff",
  "xAxis.gridType": "dashed",
  "xAxis.gridWidth": "0.5",
  "yAxis.labelnumb": "18",
  "yAxis.labelcolor": "#ffffff",
  "yAxis.showTick": false
}'
Here, we have moved the x-axis to the top of the chart and changed the color and size of the labels on the x and y axes. Besides that, we have removed the tick lines from the y-axis and changed some of the configs related to the x-axis grid lines.
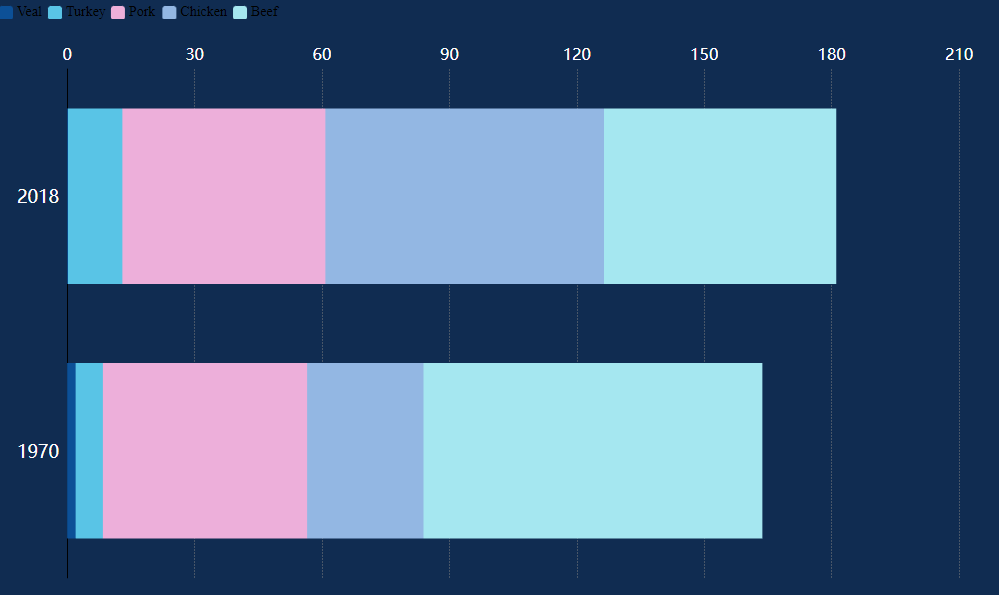
Now it’s time to set a title and bring the legend labels out of the darkness!
curl -X 'PATCH' \
  'https://api.plotset.com/v1/chart/<Your chart id>/config' \
  -H 'accept: application/json' \
  -H 'Authorization: <Your API Key>' \
  -H 'Content-Type: application/json' \
  -d '{
  "header.title": "U.S. consumption per capita (Ibs)",
  "header.title_font_size": 45,
  "header.title_color": "#ffffff",
  "header.alignment": "center",
  "legend.swatchesWidth": 0,
  "legend.swatchesHeight": 0,
  "legend.swatchesPadding": 40,
  "legend.categoryLabelColor": "auto",
  "legend.alignment": "center",
  "legend.labelFontSizer": "custom",
  "legend.labelCustomFontSize": 25
}'
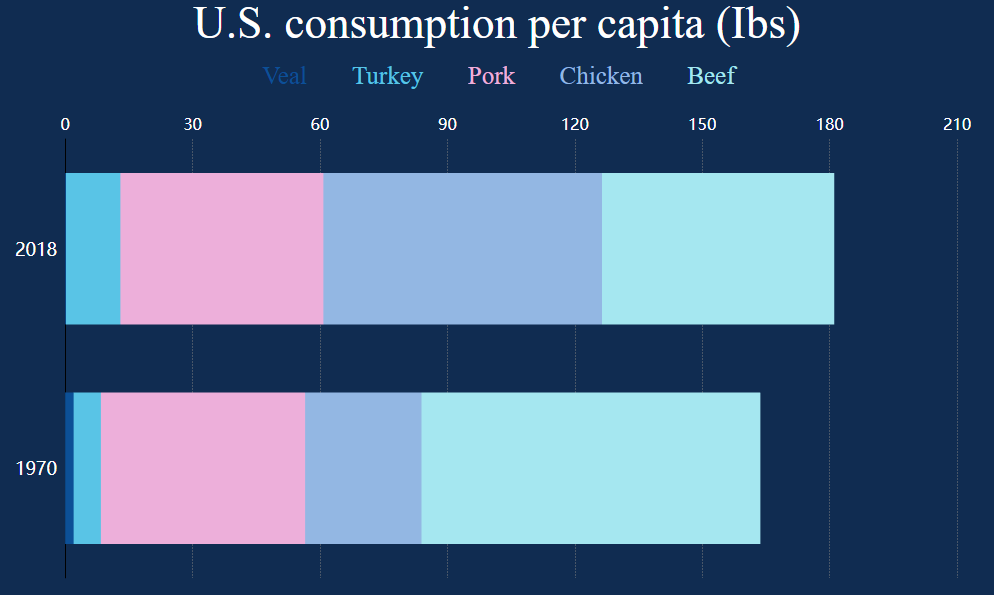
We have removed the swatches by setting their width and height equal to 0. By setting the legend category label color to auto, label colors would be the same as the colors in the chart itself.
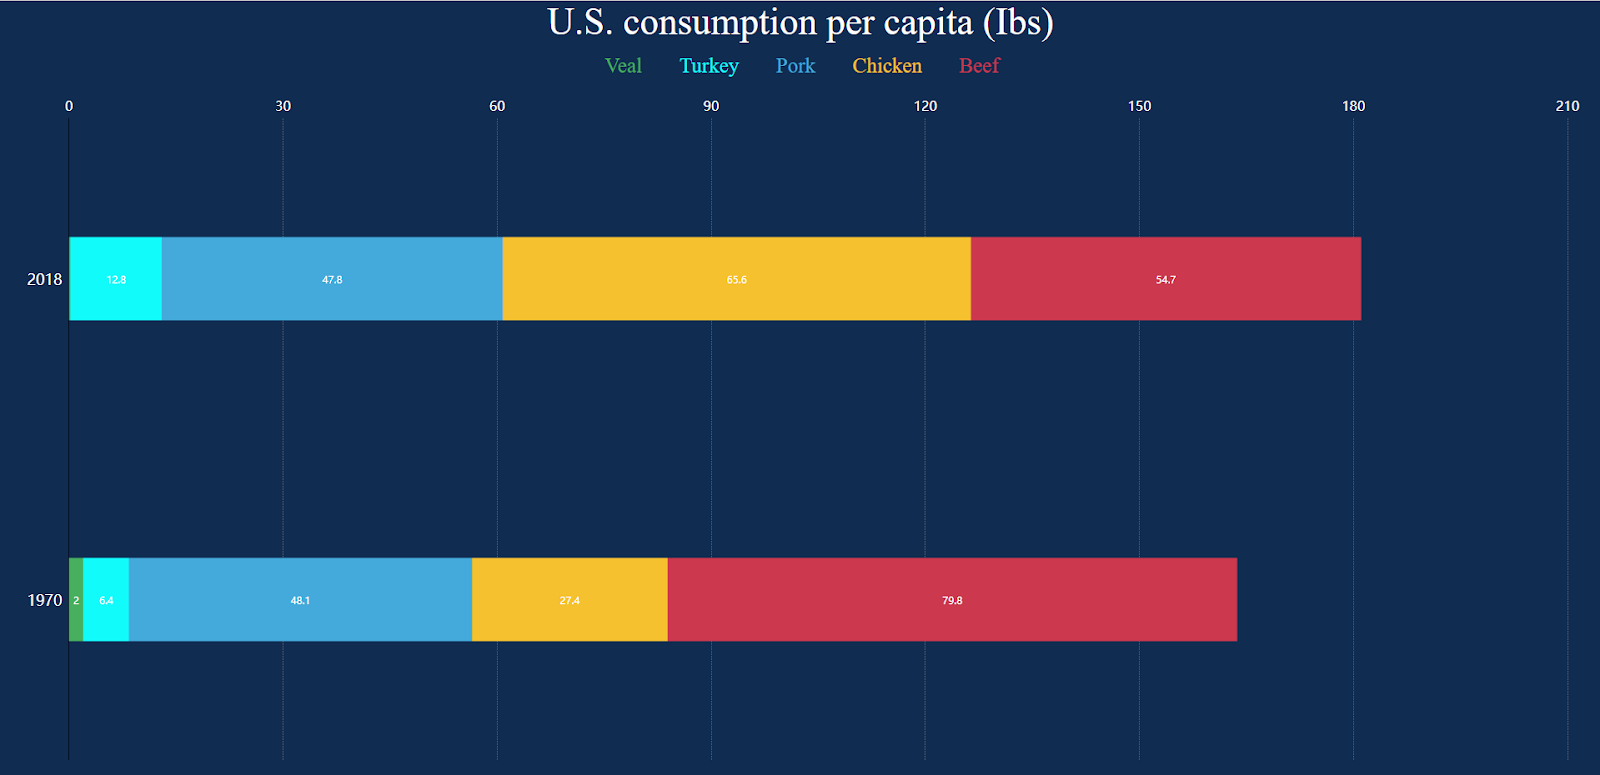
Now for the final round, we are going to change the color and size of the bars, and also we prefer to see the numbers on them.
curl -X 'PATCH' \
  'https://api.plotset.com/v1/chart/<Your chart id>/config' \
  -H 'accept: application/json' \
  -H 'Authorization: <Your API Key>' \
  -H 'Content-Type: application/json' \
  -d '{
  "palette.colors": [
      "#47af5e",
      "#11fbfb",
      "#43aadb",
      "#f5c12e",
      "#cc384d",
      "#CBB0E3",
      "#D6E3B0",
      "#E3B0B0"
    ],
  "column.label.show": true,
  "columns.bar.barWidth": 100
}'
And voila: