Creating a Chart
PlotSet offers you various types of charts to boost your data visualization, including bar charts, line charts, scatter plots, pie charts, maps, graphs and flows, and many more. Providing enough resources, PlotSet strives to enhance your confidence and facilitate you in creating outstanding stories. In this tutorial, you will learn how to create charts that suit your needs best, add and edit data to them, and change the coloring using PlotSet API.
Token Access Required
In order to access the API, you need to create a personal access token for yourself. You can easily generate your free access token here.
How to create a chart
Let’s learn how to make a beautiful interactive chart. In case you need access to our available templates to choose the best one for your data, visit here.
Let’s begin.
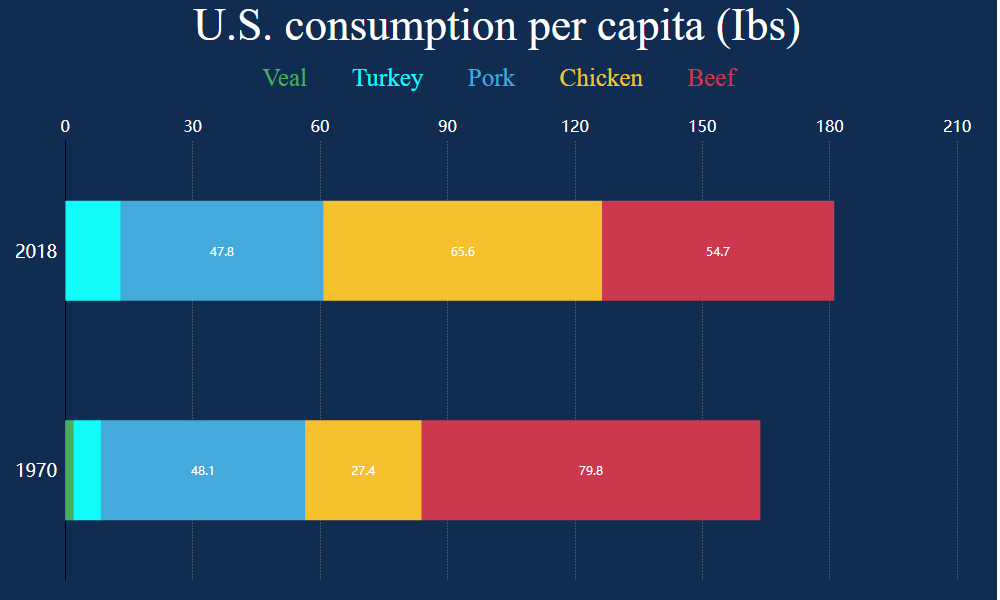
You can create your charts with our API here. Assume that we want to create a stacked bar chart to compare meat consumption in the U.S. in the 70s and late 2010s. In that case, your API request would look like this:
   curl -X 'POST' \
   'https://api.plotset.com/v1/chart' \
   -H 'accept: application/json' \
   -H 'Authorization: <Your API Key>' \
   -H 'Content-Type: application/json' \
   -d '{
   "title": "U.S. meat consumption",
   "templateId": "stacked-bar-chart"
   }'
In the response body you can find the chart id.
That is how you create a chart. Easy, right?
Bear in mind that your chart ID is an important part of this procedure because it enables you to access more API requests. Therefore, it is necessary to remember your chart ID.