Palette Settings
Here, you can learn how to work with colors and change them to suit your tastes.
| Key | Type | Description |
|---|---|---|
| palette.bg_color | string | chart background color |
| palette.type | string | mono,spectrum,multi |
| palette.colors | string[] | array of hex colors |
| palette.isAdvancedMode | bool | if you set this true , you should also fill 'advanced_multi' too |
| palette.advanced_multi | Map{}[] | [ { color: "red", columns: "a-g,h,i", "legend": "legend title"} ] |
For Chart Developers :
Advanced mode
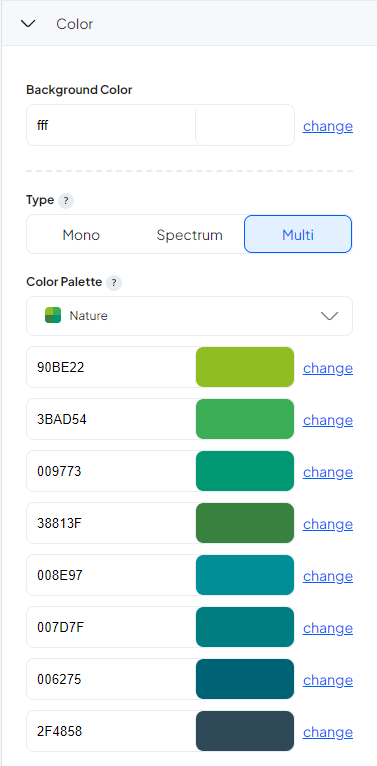
In the color settings, you can access mono, spectrum, and multi options for the color outlet. If you select the multi-option, you can choose among beautiful color palettes a set of colors that suit your chart. The advanced options give you the freedom to customize your chart as you like so that you can change the color of each column freely.
in the chart 'palette.advanced_multi' will converts too 'palette.advancedMode' and its like this:
[
  {
    "color": "red",
    "columns": ["col 1","col 2"],
    "legend": "legend name"
  }
]
For API users
When you are making a chart on the PlotSet panel, you can easily move about as you wish and change the colors with just a click of a button. Using the API Docs, you need to use the right color ID to land the change you have in mind. Here’s the map of our color palette. Use it wisely!